
This is a technique widely known as a Trading Strategy For The West. The descending triangle forex pattern is mostly used in the prediction of breakouts. This type of pattern mainly occurs in downtrends. The pattern can also be seen on ranging uptrends.
If you are wondering how to get started trading this sort of pattern, you are in luck since we will help you get started.
Where Is The Descending Triangle Forex Used?
Descending Triangle Forex Types
There are two main types of descending triangle forex patterns:
- Trend Continuation
- Trend Reversal
In the case of a downtrend, a bullish descending triangle forex pattern is known as a reversal pattern. In the case of an uptrend, a bullish descending triangle forex pattern is known as a continuation pattern.
Confused? Don’t worry, you will be a master of this strategy after going through this article.
Let us look at the strategies that make this pattern so valuable to traders.
Before using this strategy, I advise you to back-test and use it on the demo account before going live.
How Is A Descending Triangle Forex Pattern Plotted?
This type of pattern is formed by a trendline sloping towards the right and a horizontal line plotted below it. The pattern is said to have been formed once there is an occurrence of two support and resistance levels.
This sort of pattern may be referred to as a descending wedge pattern by some traders.
Whenever the market breaks the support level (horizontal line) we usually expect a strong downward movement of the market.
This is the opposite of what to expect when the market break above the resistance level (sloping trendline). We now expect the market to go bullish.

How Is A Descending Triangle Forex Pattern Traded?
As we said before, this pattern can have two outcomes. The first can be a bullish trigger while the second can be a bearish trigger.
Let us look at both scenarios:
Bearish Trigger
This occurs when the market breaks the support level of the descending triangle forex pattern. You will need to have an entry to this sort of trigger. Entries can be made either through a retest of the support area or the break and close below a candlestick.
Targets can be placed in two ways. You can measure the distance between the first support level and the first high level and use that as your target. Or you can also target the next possible support level in the market.
Bullish Trigger
This is the opposite of the bearish trigger. It occurs when the resistance level of the descending triangle forex pattern is broken.
Just like in the bearish trigger, entries can be made on a retest or a break and close above a candlestick.
In this case, targets are placed near the next resistance level or the distance between the high and support.
I leave the targeting to you. Just make sure that you develop a rules-based strategy to be able to enter and exit the market accordingly.
Up next, we will take a look at five strategies you can use while trading this pattern. You can improve on the strategies to make them your own.
1. Descending Triangle Breakout Strategy
For you to be able to trade this strategy, you must be conversant with identifying trends. It is a straightforward strategy that involves the use of volumes and trends. This is a strategy that is mostly used by day traders but can be traded by all types of traders.
Firstly, you will need to identify the market trend in the currency pair or stock you want to trade. Based on your trading rules, plot the descending triangle forex pattern on the charts. Wait on the price action movement to show you what is happening in the market.
As the market continues to move, you can plot the pattern more accurately. Make sure to observe the highs and lows being formed.
Combining The Strategy With Volumes
This strategy cannot be complete without the volume. Once you draw the pattern watch out for the volume movement. Whenever there is plenty of market activity the volume will always spike. This indicates either more buyers or sellers getting into the market.
An example below demonstrates how a stock market formed a triangle pattern on the daily chart. The market was ranging or some may call it consolidating. Based on the volume graph many traders got into the market after the second lower low formation.
This action pushed the market upwards breaking the triangle resistance level. A good place to get into this market would be immediately after the break of the resistance level.

Note that the volumes are lower at the point of break out at the resistance level. This can be a great notifier to prepare to get into a trade after a spike in volume.
You can place your targets using two methods.
- By taking the distance between the first high and the first low.
- Targeting the next major resistance level.
This strategy requires patience to execute effectively. It will need you to be on the lookout for breaks in the resistance level.
2. The Descending Heikin Ashi Triangle Strategy
These charts are usually visually different compared to other charts. Combining the descending triangle forex pattern with Heikin Ashi charts creates a powerful trading strategy.
One major advantage these charts have over others is the easy identification of trends. This is usually a common problem that beginners encounter.
As a trader, you will be needed to identify the pattern on the charts first. You will then wait for a bullish trend to be visible. This is shown by the Heikin Ashi candlesticks as they turn bullish just before the breakout.
The chart below shows an example of the Heikin Ashi chart in a 1-hour time frame.

Use two methods in targeting your profits:
- By taking the distance between the first high and the first low.
- Targeting the next major resistance level.
You can also use volumes in this strategy as an additional tool. The volumes help in indicating a potential breakout before it actually happens. This strategy is most effective in short-term trading.
BONUS:
Choosing a broker is very important for your trading career, which is why I recommend Super Forex. This is a broker that I have used for the past 4 years. Create an account now by clicking here.
3. The Explosion Moving Average Strategy
Moving averages are an everyday asset to traders. These are trend indicators whose main purpose is to guide a trader based on their strategy. Just like their name suggests, these types of technical indicators show traders the trend direction.
What we advise using is the 20-exponential moving average. This is a very crucial trend indicator when anticipating breakouts. However, this strategy has two approaches.
First Approach
We need to identify the descending triangle forex pattern first and plot it on the charts. After plotting the pattern, we wait for the market to start bouncing off the 20-moving average. This will be a great indicator of the market moving out of the consolidation phase and back into the trending phase.
Second Approach
After identifying the pattern, plot two moving averages. The 10 and 20 exponential moving averages. Once the 10-exponential moving average crosses above the 20-exponential moving average, that gives us a bullish signal. This movement is known as the cross-over.

This second approach can be combined with the first approach. Watch out for the market getting supported by the 20-exponential moving average. This indicates a potential breakout.
You will, however, not see the crossover before the breakout in some cases. A breakout and a crossover are strong signals that the market will go in that direction. One should still have an entry reason as to why you will be buying at that moment.
Always remember to follow your rules even while trading this strategy. Remember that the moving averages are only there to guide you and not determine your entry.
While trading this strategy there will be no need to use the volumes.
Targeting will be similar to the first two strategies that we have already discussed in this article.
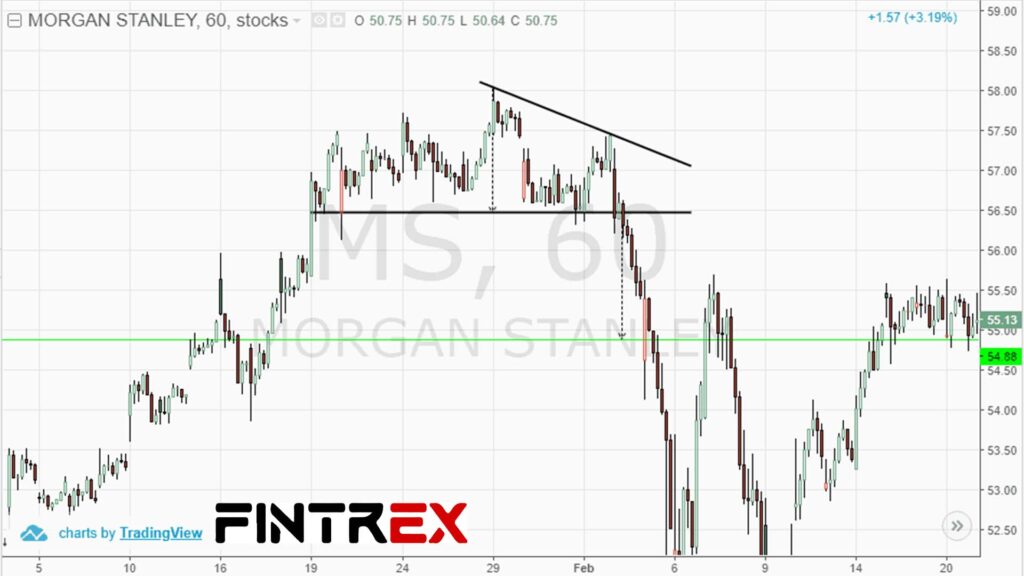
4. The Descending Triangle Reversal Top Strategy
Just like we have seen the great use of this pattern in predicting continuation, we will also discover its role in predicting reversals. The above strategy is used in predicting reversals of uptrends.
This pattern is used effectively with the helping hand of the volumes. The volumes usually show a decline with the formation of new lower highs. As we all know by now, the formation of lower highs in most cases indicates the bulls are losing momentum.
This will form a support level at a horizontal line where the bulls will be attempting to regain their trend. Resistance at a trendline resistance level will only solidify the bears new found strength in the market.
Once the price action constricts towards the end of the pattern, we usually expect the bears to be stronger. As a result, the horizontal line support level will be broken. The break in support will anticipate a downward movement in the market.
How To Place Targets
Targets can be placed at the next major support level of the market. We usually advise placing the targets just before the support zone. This helps in avoiding driving a winning trade to become a losing trade.
Another way to target profits is by measuring the first high and the first low. You then measure the distance below the breakout and modify your take profit.
In the image below, note how the support level above holds the market before the bears break below it. This is a perfect example of a descending triangle forex pattern at the top of a trend.
5. The Descending Triangle Reversal Bottom Strategy
This strategy is used in predicting reversals from a downtrend. In this case price action fails to make new lows at the end of a downtrend.
Once you identify this, draw the descending wedge pattern and observe what the price does. Use the trendline and horizontal lines to draw the pattern.
Each failure to break the support level is followed by a failure to break the highs. This constricts the pattern toward the bottom of the pattern, which builds up more pressure.
As pressure builds, the bulls manage to break above the trendline signaling a potential uptrend. A release in pressure on the markets results in a volatile upward movement. This pushes the market upwards resulting in long positions along the way.
Targets can be taken just like from our previous strategies. The distance from the high and low. One can also target the next major resistance level from the upcoming uptrend.

What To Consider While Trading the Descending Triangle Forex Pattern
You should be aware that there might never be the perfect formation of a descending triangle forex pattern. Once you identify the pattern and it follows your rules, it is important to go with your view and take the trades.
Make sure to back-test any of the strategies that we have discussed. You can do this by placing trades in history and by demo trading. Don’t ignore one and do the other. Both are equally important.
You can be able to develop your own strategy from the ones we have learned above. This knowledge can also be blended with your technical and fundamental analysis prowess.
It’s not a requirement for you to use the targeting strategy stated in this article. You can combine your own profit targeting and be able to become profitable while at it.
Frequently Asked Questions About The Descending Triangle Forex Pattern
Just like any other strategies covered in our Fintrex Fx Free Forex Course, this pattern can be used in buying and selling stocks. The trades placed should still be subjected to rules and proper risk management. Trading the breakout, as mentioned in the article, is the most effective way to trade this strategy.
The descending triangle forex pattern usually indicates weaker bullish momentum in play. The resulting movement is usually unknown as the market can either go down or up after consolidation.
The volumes are usually a great indicator of this pattern strategy. The volume spike usually indicates stronger momentum building just before a breakout.
Conclusion
The descending triangle forex pattern can be used in both uptrends and downtrends. As we have seen, it is mostly subject to downtrends but is also a big indicator of reversals in uptrends. In most cases, after a breakout, the momentum is usually swift and precise. The trading strategy can easily be combined with other trading strategies to form powerful outcomes.


[…] to our ECN trading […]